First, use the command
nvidia-smi -l 1 to monitor the GPU utilization.- If the GPU utilization is 0, check whether your code is correctly calling the GPU for computation.
- If the GPU utilization is already above 90%, consider switching to multi-GPU parallelism or using a more powerful GPU.
Give a Stress Test
If you notice that the training speed is significantly slow, you can use the following code to perform a stress test to rule out hardware issues and observe the GPU utilization:Bottleneck Analysis
First, determine the characteristics of the model you are training. In terms of performance, there are several scenarios:1. Small Model with Simple Data Preprocessing
1. Small Model with Simple Data Preprocessing
For example, training MNIST with LeNet. In this case, there is limited room for optimization because the model itself has low computational demands. A standard GPU is sufficient, and using a more powerful GPU will result in lower utilization. The GPU utilization in this scenario is typically low but stable.
2. Small Model with Complex Data Preprocessing
2. Small Model with Complex Data Preprocessing
For example, using a ResNet-18 network for ImageNet classification. Here, CPU preprocessing takes longer, while GPU computation is very fast and occupies a short period. Therefore, it is better to choose a more powerful CPU and a standard GPU. The GPU utilization in this scenario is highly variable, with high peaks but mostly low values.
3. Large Model with Simple Data Preprocessing
3. Large Model with Simple Data Preprocessing
In this case, the GPU utilization is generally high and stable, but the demands on disk performance are also high. If the utilization is low, refer to the methods below to optimize performance.
4. Large Model with Complex Data Preprocessing
4. Large Model with Complex Data Preprocessing
This scenario places high demands on both the CPU and GPU, and either can become a bottleneck, including disk performance. Each algorithm needs to be analyzed individually.
If the GPU utilization remains at 0, please confirm that Ampere architecture GPUs such as the 3060, 3090, 3080Ti, A4000, A40, A100, and A5000 require CUDA 11.x (preferably CUDA 11.1 or higher) to function properly. Please use a higher version of the framework.
Step 1: Check GPU Utilization
Run the commandnvidia-smi -l 1 in the terminal.
Step 2: Check CPU Usage
Please locate the instance monitoring button under Console -> Instances.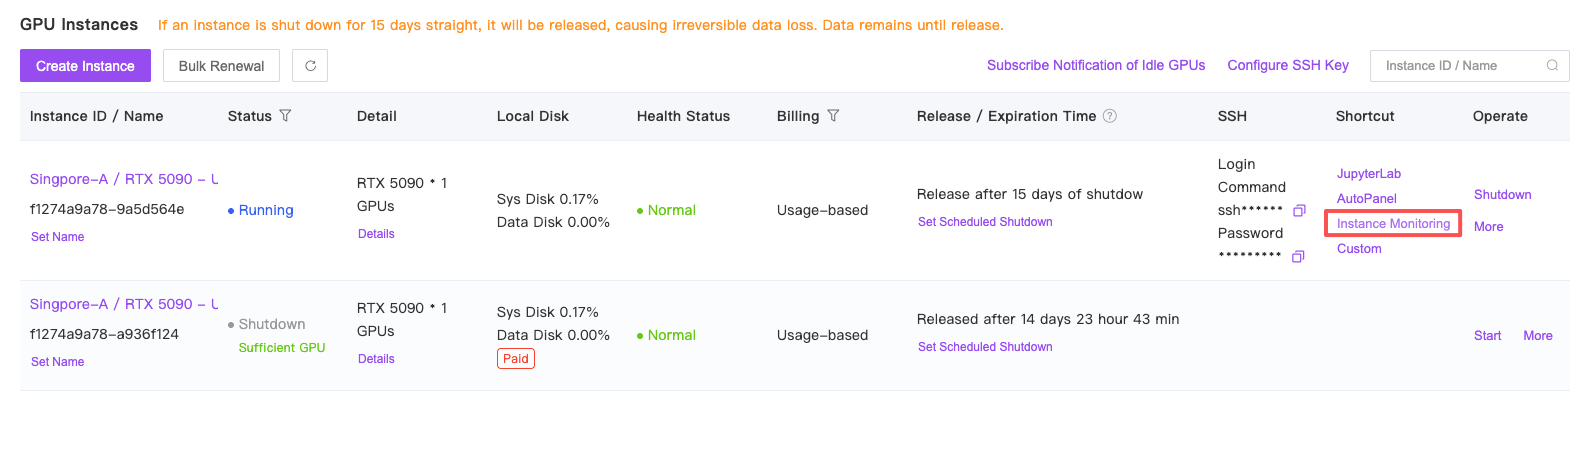
- Assess CPU Utilization:
- Assume your instance has 5 CPU cores.
- If the CPU utilization is close to 500% (indicating all 5 cores are under high load), this suggests a potential bottleneck due to insufficient CPU capacity.
- Addressing High CPU Utilization:
- Migrate the instance: Move the instance to a host with more CPU cores.
- Upgrade the configuration: Increase the CPU allocation for the instance.
- Optimizing Low CPU Utilization:
- If the CPU utilization is significantly below 500%, it indicates that your code is not fully utilizing the available CPU power.
- Adjust
num_workers: Increase the CPU load by modifying thenum_workersparameter in the Torch Dataloader. - AOptimal Setting: Set
num_workersto a value slightly less than the number of CPU cores. - Test Performance: Experiment with different
num_workersvalues to determine their impact on performance.
Step 3: Inspect the Code
If the above steps do not resolve the issue, please debug the code to identify and analyze the lines that are time-consuming. There are several common coding practices that can impact performance; please review the following:- Performing non-computational operations in each iteration: For example, saving test images. The solution is to increase the interval for saving test images to avoid additional time-consuming operations in every iteration.
- Frequent model saving: This can occupy a significant portion of the training time.
- Refer to the official performance optimization guides:
We also welcome you to submit feedback on other cases via the website to share knowledge.
Others
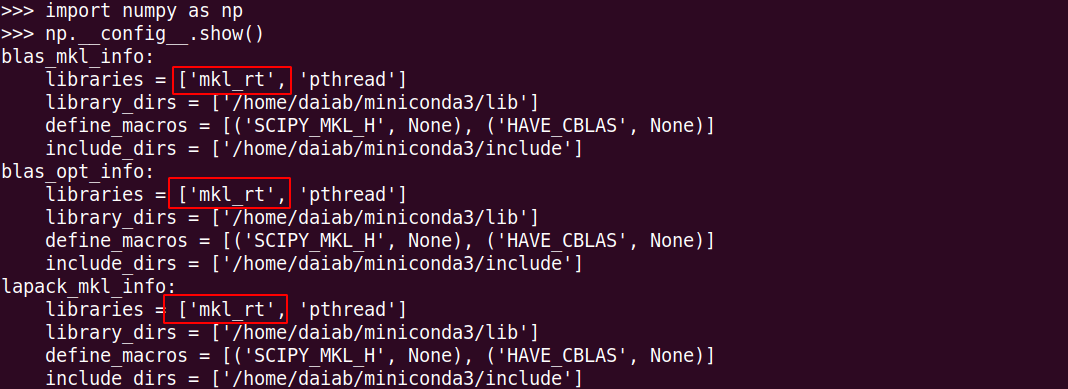
NumPy Version Issues
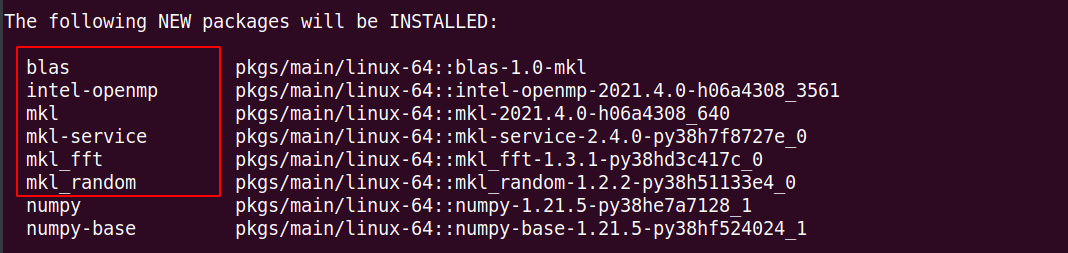
Preliminary Identification Method: If the CPU load is extremely high, with all cores fully utilized, and increasing the number of cores still results in full CPU utilization, while the GPU load remains low, and you are using an Intel CPU, there is a high likelihood that the performance issue is due to the version of NumPy being used.
conda install numpy.
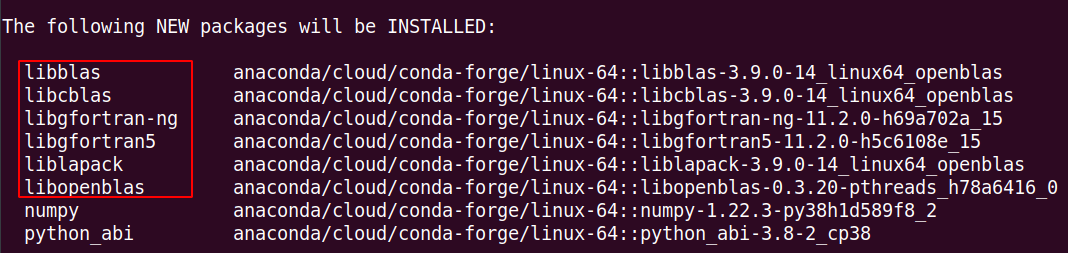
- Uninstall the current NumPy:
pip uninstall numpy(or if installed via conda, useconda uninstall numpy) - Remove the domestic Conda repository:
echo "" > /root/.condarc - Reinstall NumPy:
conda install numpy
PyTorch Thread Count Issues
Preliminary Identification Method: If you are renting a multi-GPU instance and running different experiments on each GPU, this may be the issue.
torch.set_num_threads(N) to set the number of threads for each process.
Additional Tips:
- If you are using single-machine multi-GPU parallelism with PyTorch, replacing
torch.nn.DataParallel (DP)withtorch.nn.DistributedDataParallel (DDP)generally improves performance. The official statement is: “DistributedDataParallel offers much better performance and scaling to multiple GPUs.” - For NVIDIA GPUs with Ampere architecture, such as RTX 3090, using the latest versions of PyTorch 1.9 and 1.10 can significantly improve performance compared to version 1.7. Versions 1.7 and 1.8 have relatively poor performance. (You can switch to a PyTorch 1.10 image in the “More Operations” section after shutting down.)
- When using the platform, if your algorithm is resource-intensive, it is best to run different experiments on separate hosts rather than on the same host or within the same instance with multiple GPUs running different experiments.